

One of the most challenging concepts for new Power BI users is to understand the difference between Measures and Calculated Columns. Or, to be more specific, the concept itself is not a big issue, but the most daunting thing for Power BI rookies is to understand when to use which.
Since I’ve already written about the use-cases for both Calculated Columns and Measures, and briefly explained different scenarios when you want to use each of those, while recently presenting at the New Stars of Data conference, I’ve got a question to explain the difference between explicit and implicit measures. I’ve already answered here shortly, but I promised to dedicate a separate blog post to this topic.
So, in this article, I will focus solely on Measures, and try to explain in-depth the difference between explicit and implicit measures.
Implicit, Explicit…What ?!
Ok, you’ve heard about Measures in Power BI, and that’s it. What on Earth are now implicit measures?! Or explicit? Don’t panic, keep reading and I promise you that by the end of this article, you will have a good understanding of those two and what are their main advantages and downsides.
Implicit measures – “Thank you” Power BI
First of all, I know that we all like things that are automatically created for us, and Power BI does pretty well in that regard. One of the things Power BI performs for us is creating of implicit measures.
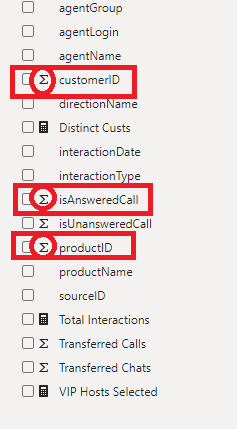
As you can notice in the illustration above, Power BI identified numeric fields in our data model and automatically marked them with the Sigma sign. That means that these column values will be summarized, once you drag them to a report visual.
Let’s check how this works in reality:
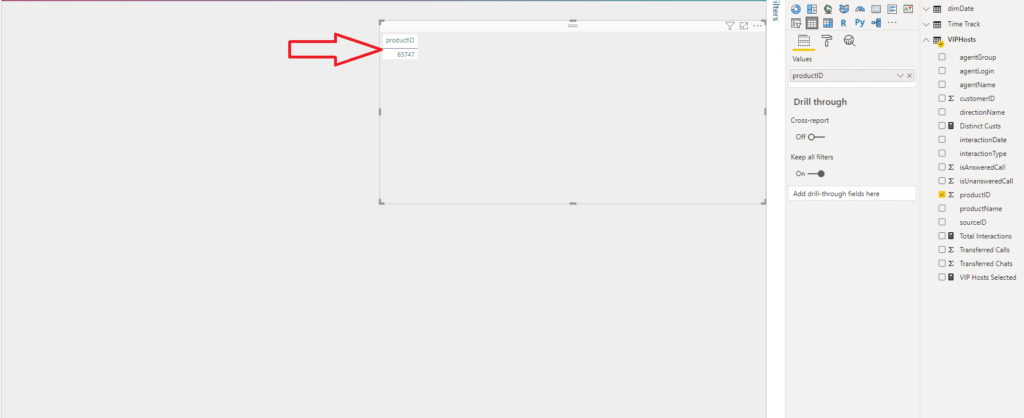
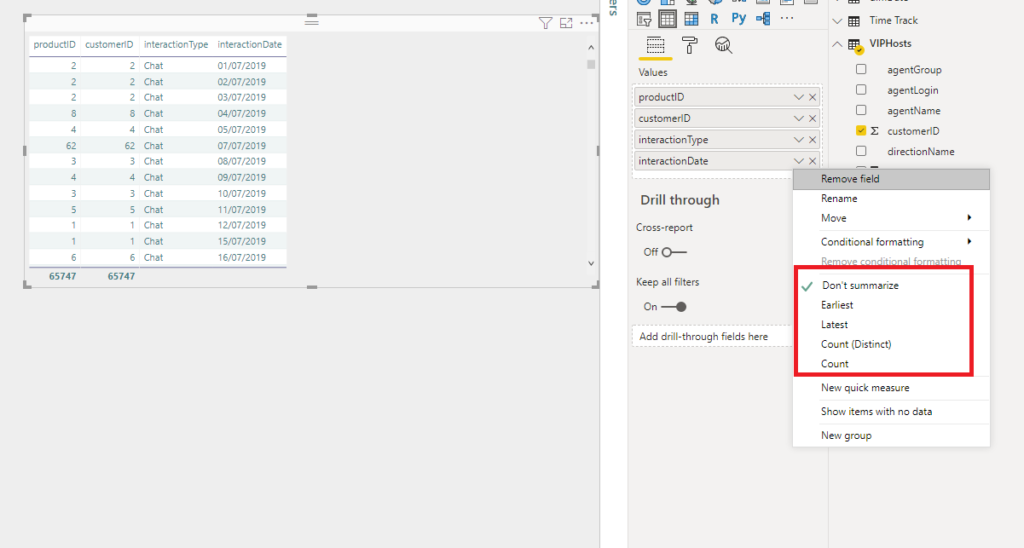
I’ve dragged my productID column into the table visual and I see that Power BI automatically applied some kind of aggregation. Now, you can define what type of aggregation you want to apply to a specific column, or not to aggregate at all (hint: choose Don’t Summarize option):
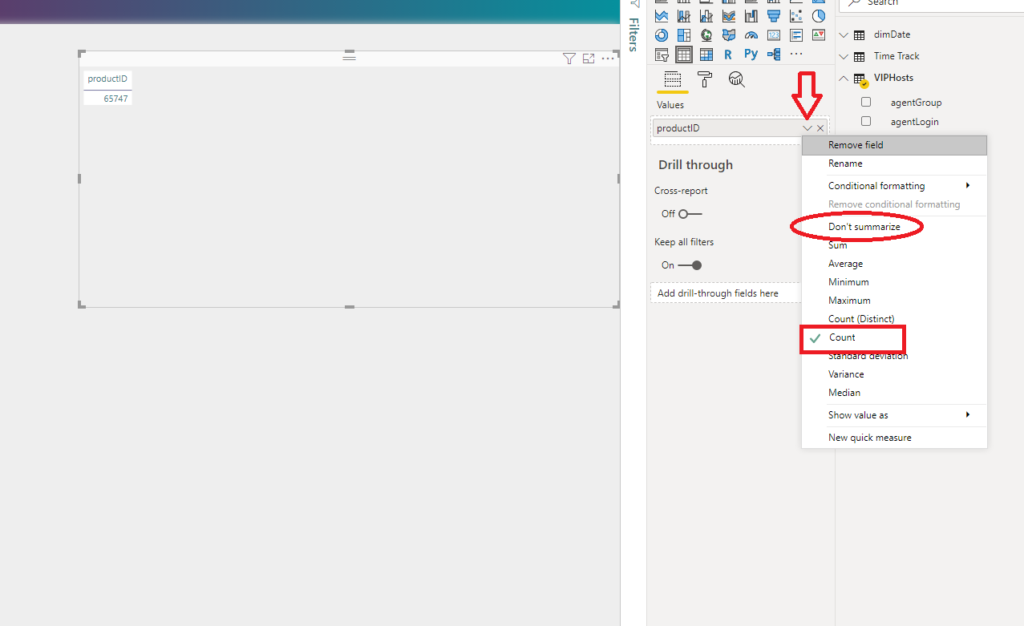
Here, Power BI performed the Count aggregate function over my productID column. Looking at the picture above, one can (too) easily conclude that there is a lot of flexibility when working with implicit measures – you can choose between a bunch of predefined aggregations, including even fancy statistics’ calculations, such as Standard Deviation, Variance, or Median…All of that, with just one single click!
So, why should someone bother writing DAX, when (almost) everything is already pre-baked for us?
Before I show you why using implicit measures can come back to haunt you, let me just shortly overview how implicit measures work with non-numeric fields in your data model.
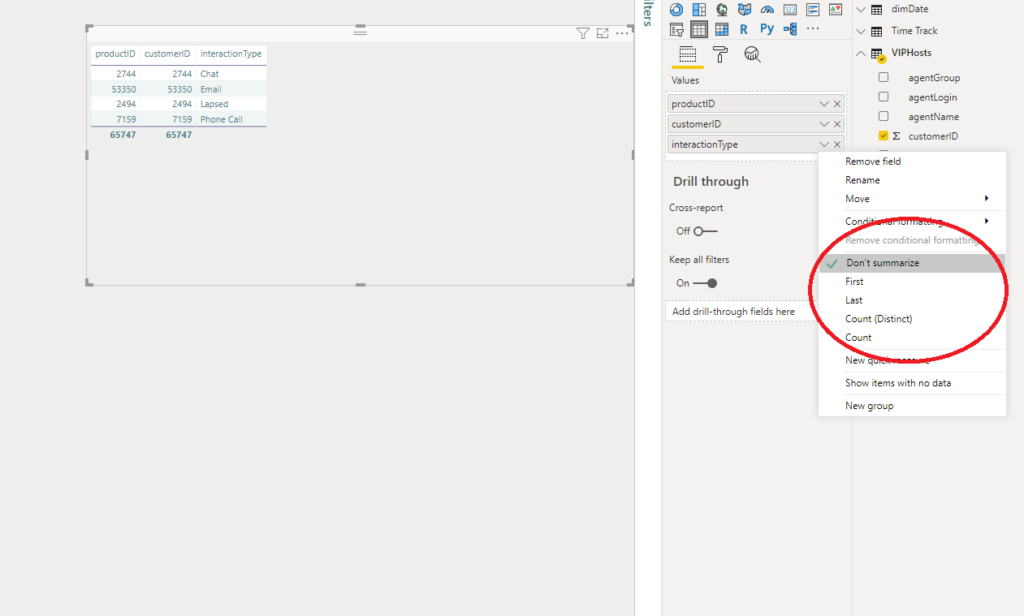
My text field InteractionType can be summarized in four different ways: First, Last, Count (Distinct), and Count. Of course, it can be also non-summarized, like in the example above.
Similar, Date columns offer their own set of predefined aggregations:
Limitations of implicit measures
No matter how appealing looks the possibility to save time and effort by using automatically created measures, you should try to avoid that, as it comes with some obvious downsides.
Imagine that you have a non-additive or semi-additive measure, such as the Unit price of the product, or bank account balance. You don’t want these values to be simply summed in your report, as that is not expected behavior for those measures. Therefore, it can easily happen that your report produces unexpected incorrect outcomes if implicit measures are being used.
Another limitation of implicit measures is that, if you want to use them in multiple different aggregation types, you have to drag one same column multiple times, and then set different aggregation type for each of them.
Explicit measures = more flexibility!
Writing measures in an explicit way, using DAX language, requires more time and effort in the beginning since you need to do some manual work. But, you will bear the fruits later, believe me.
Back to our previous challenge – to display both the total number of customers and the total number of unique (distinct) customer in our report, can be easily solved using explicit measures:
Total Customers = COUNT(TableName[CustomerID])
Total Unique Customers = DISTINCTCOUNT(TableName[customerID])
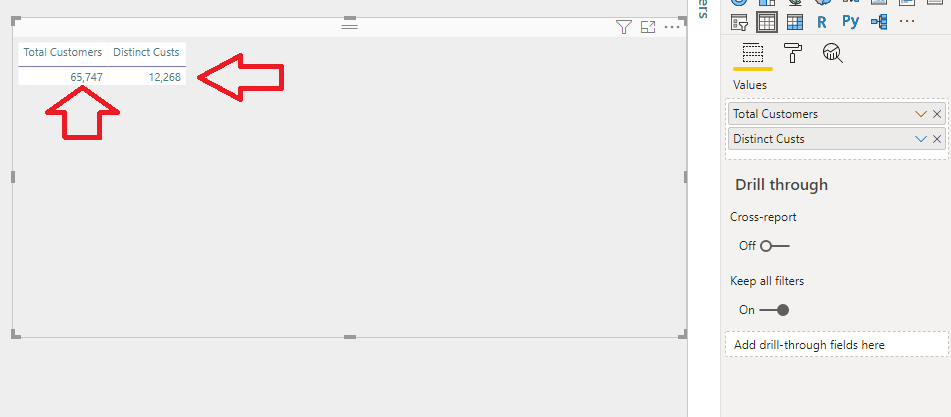
So, as you can notice, we used the same column as a reference to multiple different measures, to produce the desired outcome.
While implicit measures can support some really basic scenarios, as soon as your report needs more complex calculations, you’ll have to switch to explicit measures.
However, the main advantage of using explicit measures instead of implicit ones is their reusability. You define measure once and you can refer to it as many times as you need.
The other obvious benefit is the easier maintenance of the data model. If you create a base explicit measure, such as:
Sales Amt = SUM(TableName[Sales Amount])
You can use this measure as a reference in 20 other different measures (for example, to calculate gross margin, YoY, etc.)! If any background logic needs to be changed, you will change it at only one single place (in the base measure), and all referring measures will automatically apply the new logic.
Measures – Best practices
Now, as you learned the difference between implicit and explicit measures and obvious benefits from using the latter, let me wrap-up with some best practices regarding working with measures in your reports:

- Don’t forget to format your measures properly – that means, if you’re working with values related to money (Sales Amount, for example), you may want to format them as a Currency. Be consistent with the formatting, if your numbers are limited to two decimal places, then stick with it in the whole report
- Once you’re done with creating explicit measures based on a specific column, you should hide that column in the report. That way, you will prevent inadequate usage of the column (for example, simple summing of bank balance from the account). So, you as a data modeler take responsibility for summarization options

In this example, I defined both Total Customers and Total Unique Customers measures, so I don’t want someone to perform a SUM of customerID. Therefore, I will hide the customerID column in the Fields list.
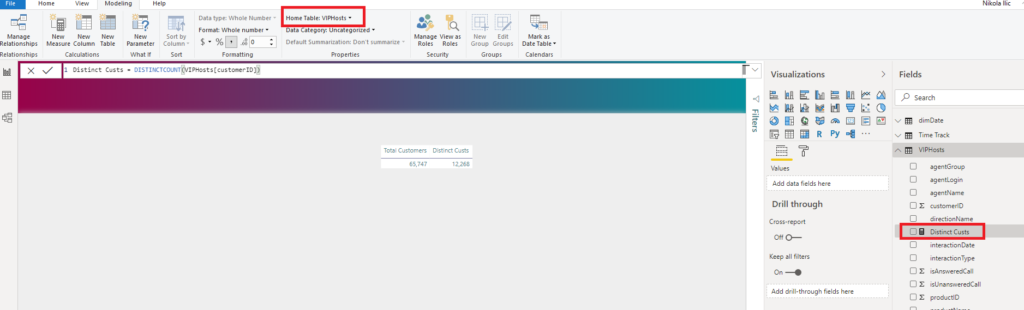
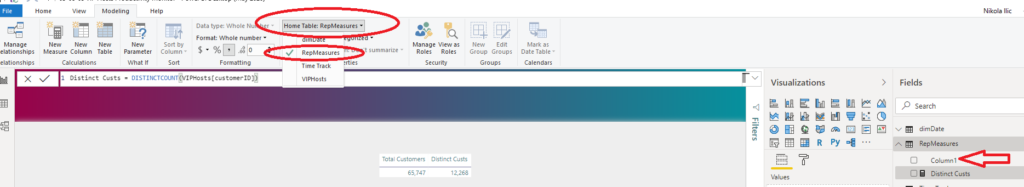
- Organize your measures into separate folders – It’s not an issue when your report has just a few measures. But, things become more complicated when you need to operate with tens or even hundreds of measures. To prevent that, I always use the following technique to better organize my measures. By default, the measure will reside in the table where you created it. You can change this by clicking on the measure, then under the Modeling tab, change the Home Table for that specific measure:
However, this will just move the measure from one table to another, which doesn’t solve the problem. In order to tackle this, I need to create a brand new table which will hold my measures only.
Under the Home tab, select Enter Data and create a plain empty table called RepMeasures:
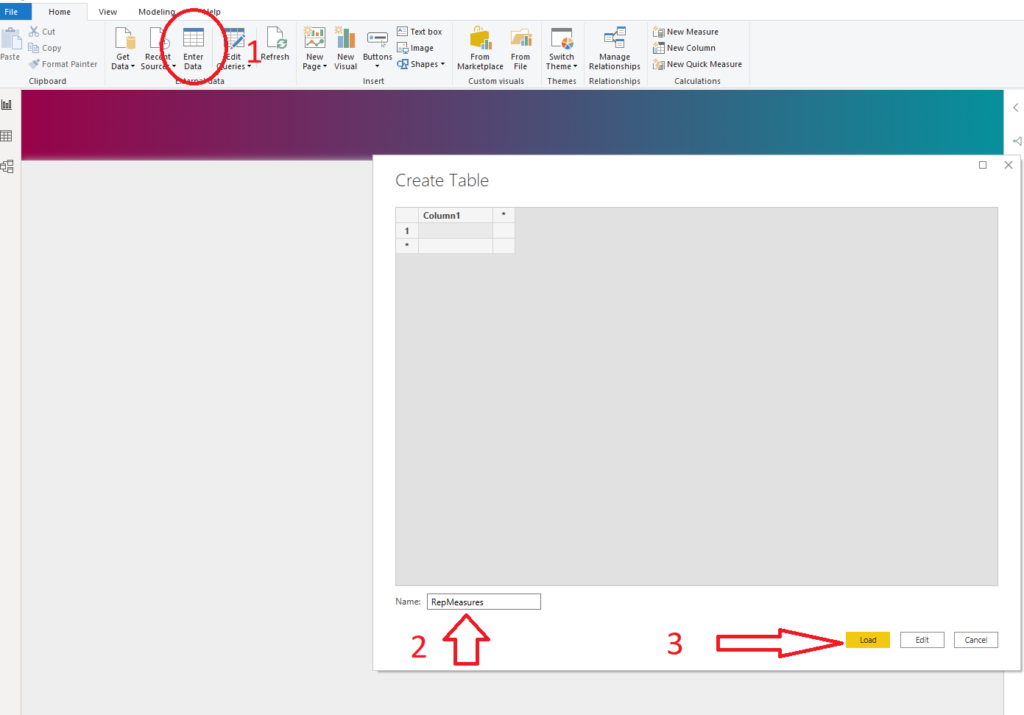
Click Load and you will see a new table in your model. After that, click on your measure, and under the Home table, select RepMeasures.
Finally, just simply delete Column 1 and you are good to go.
This way, you can separate and group your measures. Trust me, it will make your life much easier, especially once you create multiple measures in your report.
Conclusion
As I’ve already said: we all prefer to take an easier path to meet our goals. That’s completely legitimate, and Power BI is your “best friend” when it comes to supporting you on that path.
However, there are many important considerations to take into account when choosing which path to take. I don’t want to say: never use implicit measures! By writing this article, I just wanted to point some possible pitfalls and limitations when using them, and why you should still prefer writing explicit measures instead.
Thanks for reading!
Last Updated on May 2, 2021 by Nikola


autenticos y exclusivos
Great article post.Thanks Again. Will read on…
Nikola
You’re welcome!
Marcus Wegener
Nice blog post Nikola! Just to be correct, you can use implicit measures in multiple different aggregation types.
You just have to drag the column several times into the value area and assign different aggragations to it.
Love greetings
Marcus
Nikola
You’re right Marcus, thanks for pointing this out! I’ve corrected this part of the article👍
Jessica Jolly
Great article! I was just talking about explicit and implicit measures to my students. Now I have an excellent link to share with them.
Nikola
Thanks Jessica, I’m glad if you find the article helpful!
david
Hi Nikola,
now, in mid-2023 your article has been very helpful and thank you! Has fast-tracked me to better understanding some useful concepts.
Cheers,
David
Nikola
Cheers David, I’m happy to hear that:)